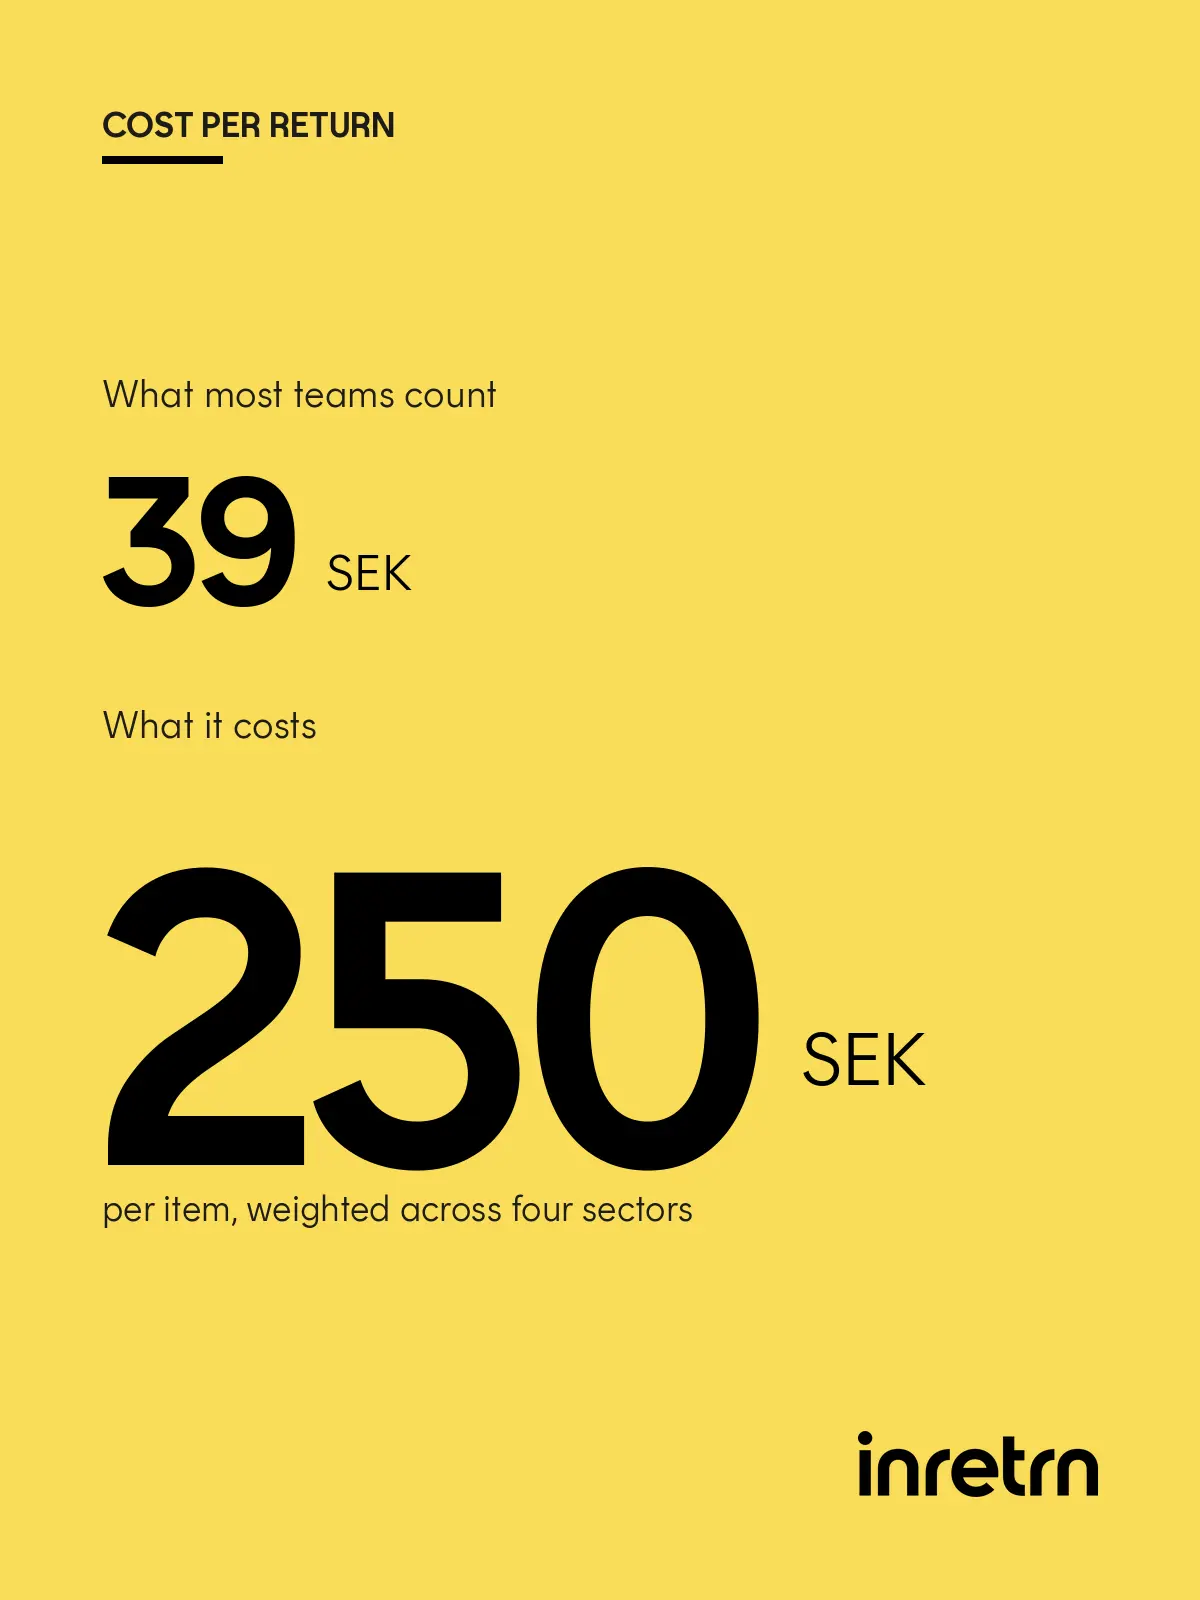
The 4 costs missing from your cost per return
The 4 costs missing from your cost per return Most returns business cases lose internally because the number at the top is too low. Here is where the missing money sits, where the data lives ...
Every team we speak to says the saving is customer service time. Almost nobody has counted it, and almost everybody is measuring the wrong thing about it.
Here is a sentence I hear in a lot of first meetings, usually within the first five minutes: it works pretty well, but I think we could save money on the customer service time.
That is a good instinct and it is almost always right. It is also where the conversation usually stops, because the next question is how much, and nobody has the number.
And there is a reason nobody has it. Customer service sits under one function. Returns sit under another. Refunds are often finance. So the ticket volume is everybody’s cost and nobody’s number, and it never appears on a single page where somebody has to answer for it.
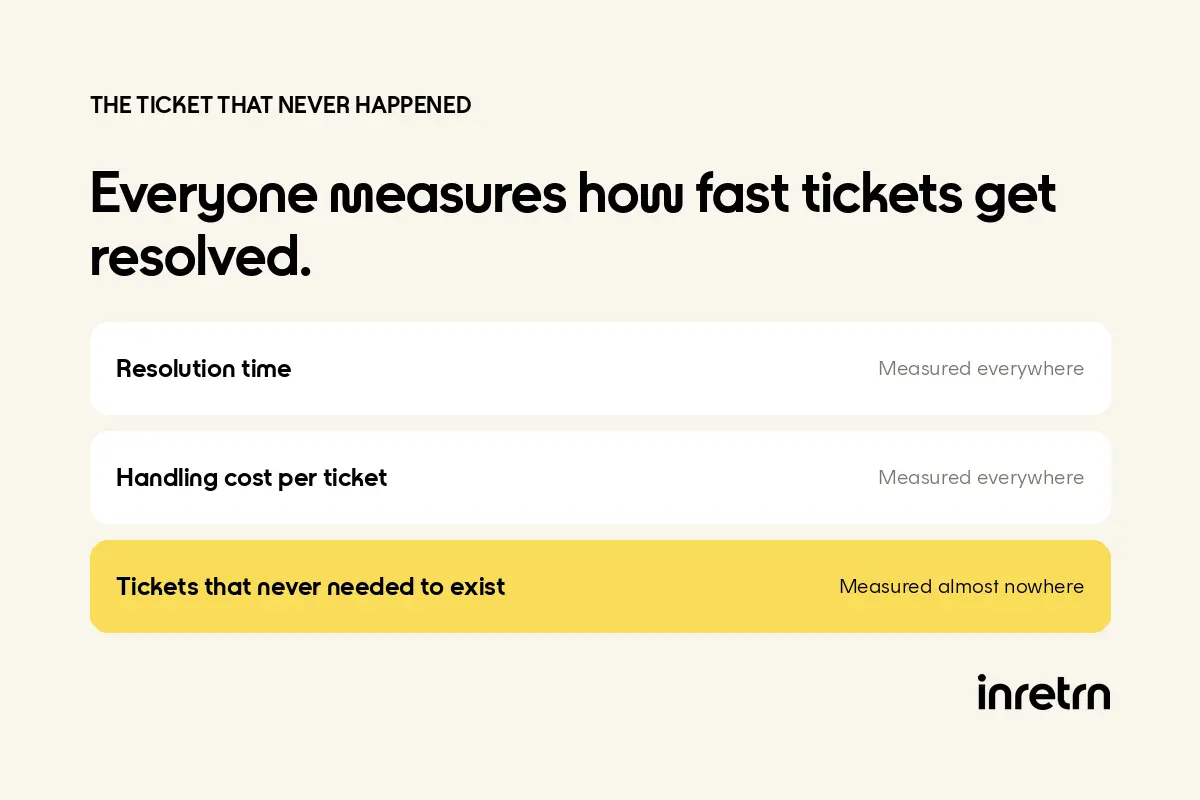
But here is the part I think is genuinely overlooked. When teams do look at customer service, they measure how fast tickets get resolved. First response time, handling time, CSAT. All useful. None of them ask the more interesting question, which is how many of those tickets ever needed to exist.
A perfect post-purchase experience is not a fast reply. It is no contact at all, because the customer already knew. That is better for them and cheaper for you, and it is the only version of this where the numbers move rather than the averages.
This one is deliberately about counting rather than about us. You do not have to believe anyone’s savings figures if you can produce your own.
Post-purchase is unusual in how thoroughly it is split up.
The returns flow belongs to ecommerce, operations or logistics. The tickets it generates belong to customer service. The refunds belong to finance, or to whoever has access to the payment system. The warehouse handling belongs to operations, and quite often to a third party.
Every one of those teams can tell you their own number. None of them owns the total, and more importantly, none of them owns the connection between them. Which is the actual problem, because ticket volume is not a customer service metric. It is an output of how the returns flow is built.
So customer service gets measured on how well they handle the volume, and nobody gets measured on whether the volume should exist.
We have seen the consequence stated plainly by the people closest to it. One team described customer service noting down what customers were sending back in a spreadsheet, because nothing in the systems recorded it. Another handled faulty items by flagging them manually in the warehouse system, which then blocked the return from being processed, so somebody had to look the customer up in a separate tool. Neither of those is a customer service failure. Both generate customer service work.
Take the published breakdown of support volume in fashion ecommerce and pull out only the post-purchase rows.
Returns and exchanges, 20 to 30 percent. Refund status, 5 to 10 percent. Damaged or wrong item, 3 to 7 percent. Return policy questions, 3 to 6 percent.
That is somewhere between a third and a half of everything your support team handles, and it is generated entirely by what happens after the parcel has arrived.
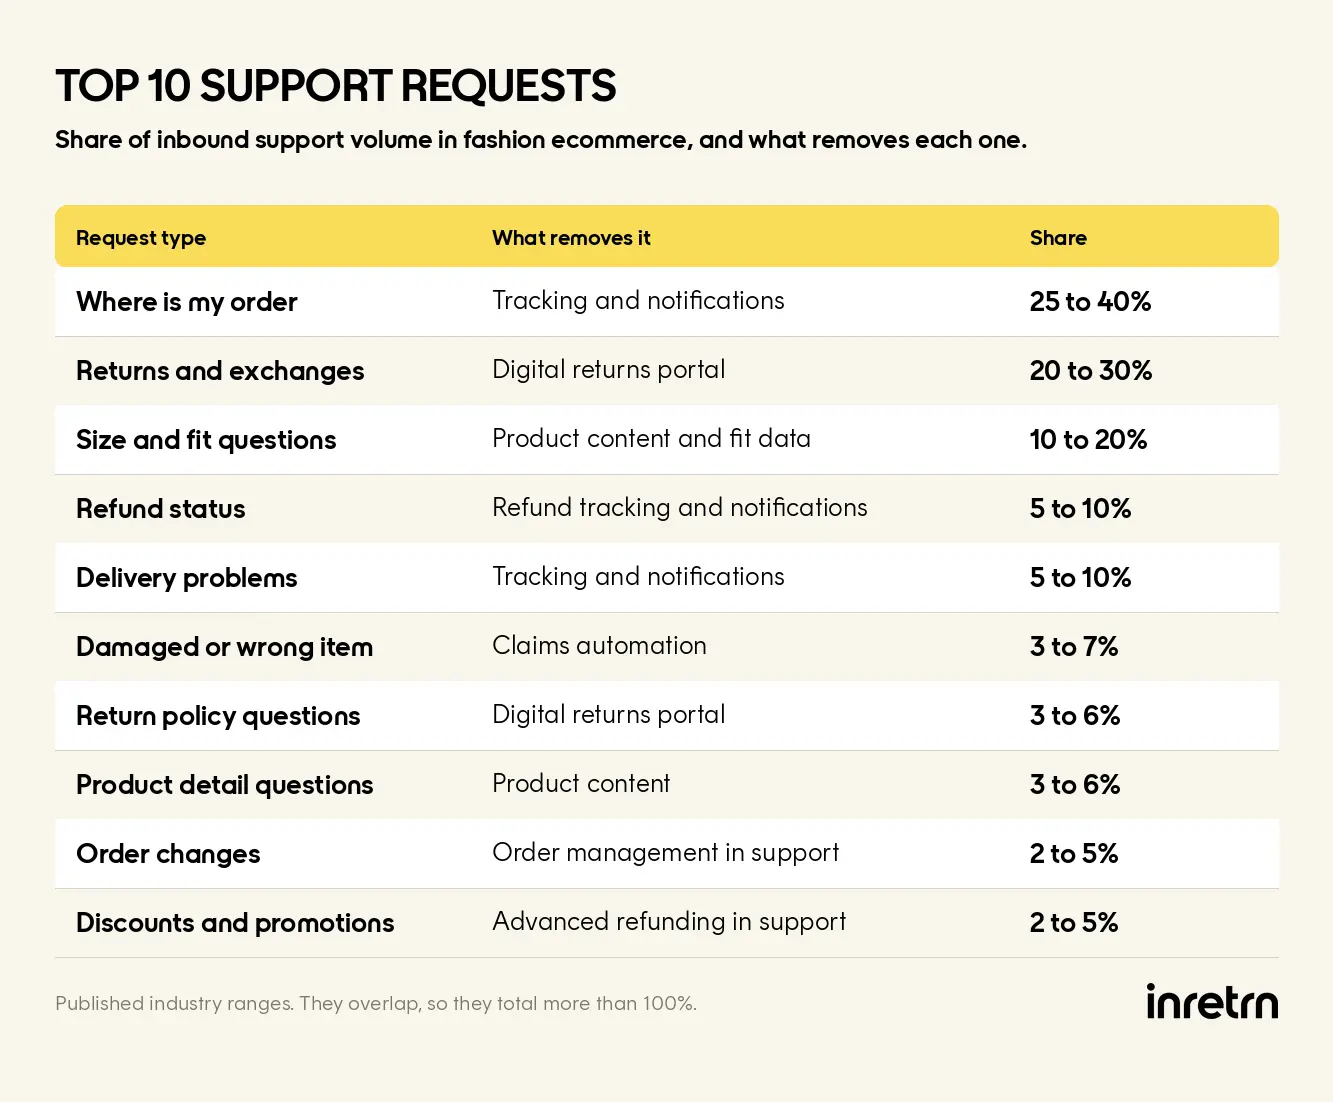
The biggest single category in the table is delivery status, which is a different problem with a different owner. Worth knowing it is there, and worth leaving alone. The post-purchase half is large enough on its own.
Two things about those rows are worth noticing. Most are status questions rather than problems. And most are asked by customers who have done nothing wrong and want nothing unreasonable. They simply cannot see.
The published cost per contact ranges from roughly five to twenty euros depending on channel and market, with phone at the high end. It does not really matter which figure you use. What matters is that the volume is largely a function of how much the customer can see without asking.
Here is the reframe, and it is the whole point of this piece.
Almost every customer service improvement project optimizes resolution. Better macros, better routing, better tooling, AI drafting replies. All of that makes each ticket cheaper and faster. None of it makes the ticket not happen.
The other approach asks a different question: for each of our post-purchase contact reasons, what would have to be true for this contact never to occur?
And for post-purchase, the answer is usually visibility rather than effort. The customer contacts you because the information exists somewhere in your operation and has not reached them. Every one of those is a contact you can delete rather than handle.
And there is already a metric for it, which surprised me. It is called the return-related ticket rate: return and exchange tickets divided by total return requests. In other words, what share of the customers who start a return also have to contact you about it.
Published benchmarks put best-in-class below 10 percent. At 20 percent, the reading is that your self-service flow is generating friction rather than removing it.
That number is worth more than any handling metric you have, because it measures the thing you can actually eliminate. And almost nobody calculates it, because it requires joining two systems that belong to two different teams.
That is a better project for three reasons. It is permanent, where handling improvements decay. It scales the right way, because eliminated tickets do not come back at peak. And it is the only version that improves the customer experience at the same time, because the best possible outcome for the customer was never a fast answer. It was not needing to ask.
One more finding worth knowing before you optimize handling. Published analysis suggests high handling time in ecommerce support is usually caused by agents switching between tabs, the support platform, the order system, the third-party warehouse portal, the carrier, rather than by questions being complicated. Which means even the handling half of the problem is mostly an integration problem wearing a training problem’s clothes.
“Where is my label.” If the label goes in the box, the customer who returns something three weeks later has thrown it away, and contacts you. If some markets get a printed label and others do not, they contact you to find out which they are. Digitize it, one QR code, no printed label in any box, and the ticket type disappears. It also removes the per-parcel cost of a label that is unused in the vast majority of orders.
“Where is my refund.” This is the one that generates most of the frustration, because it is about money and because the customer has no way to see it. One team we work with started triggering the refund earlier, on a carrier event rather than after inspection, and somewhere between 70 and 80 percent of their returns-related tickets went away. The refund did not become riskier. It became visible, and earlier, for the customers where that made sense.
“Can I still return this.” If your policy says 30 days and your flow accepts a registration on day 45, three things happen: the customer sends it, the warehouse handles it, and then somebody has to contact the customer and tell them no. That is a ticket, a shipment and a bad experience, all generated by not enforcing a rule you already have. Block it at registration and all three disappear, and the customer finds out at the moment they can still do something about it.
“This item is faulty.” Below a value you set, this should not reach a person at all. If a customer reports a fault on a twenty-euro part, the cost of a photo, a ticket and somebody’s judgment already exceeds the item. So the rule closes it: refund or replace immediately, and tell the customer to keep or recycle what they have. Nobody ships anything, nobody reads anything, and the customer gets a better answer faster than a person could have given them.
Above that threshold a person does look, because a supplier has to answer and somebody has to decide. But even then the first contact does not need to be an email. If the customer registers the claim, attaches a photo and is told what happens next, what reaches your team is a documented case rather than a conversation starting from nothing.
Worth a section of its own, because it is the least examined part of the whole flow.
Who actually issues your refunds, and in which system?
In most operations we look at, the answer involves a person. Somebody in customer service, or somebody in finance, working in the ERP or the payment provider, often from a list that arrives by email or from a ticket. Sometimes both, at different value thresholds. Sometimes a third party, if the warehouse is outsourced.
Three things follow from that, and none of them are obvious until you look.
The timing is not a policy, it is a queue. However fast your warehouse is, the refund happens when the person gets to it. Which is why refund questions spike in the same weeks the queue is longest, and why “we refund within seven days” quietly becomes eighteen in December.
Partial refunds are where the tickets are. A deduction for a missing tag, a return fee, a restocking charge: each of those needs explaining, and if it is not explained at the moment it happens, it becomes a contact. Published analysis of refund-related support suggests that status checks, timeline questions and partial refund explanations account for the large majority of all refund contacts.
And mistakes are silent. We have seen a refund go out on a return that was flagged not to be refunded, because a ticket was reopened and edited by hand. Nobody notices that class of error until somebody reconciles, which is usually much later, and sometimes never.
How to check: ask who pressed the button on the last hundred refunds, and how they knew to press it. If the answer is a person reading a list, you have found both a cost and a source of tickets.
This is a counting exercise, and it takes about a week. The point is to end up with a number you produced, because those are the only ones that survive a budget conversation.
Next: the exchange your customer wanted, and why it became a refund.
Jennie Gerum CMO, inretrn
The 4 costs missing from your cost per return Most returns business cases lose internally because the number at the top is too low. Here is where the missing money sits, where the data lives ...
You asked. We answered. Everything from the Withdrawal Webinar Q&A - in one place. Book a walkthrough ...

Post-purchase experience refers to everything that happens after a customer receives a product. In ecommerce, this stage includes interactions such as returns, exchanges, refunds, warranty cl...