Two very different things hide behind the word “exchange”
Two very different things hide behind the word "exchange" A customer wants a medium instead of a large. Simple enough. Here is what makes it hard. To say yes, you have to promise them th...
Most returns business cases lose internally because the number at the top is too low. Here is where the missing money sits, where the data lives in your systems, and how to count it before someone senior asks you to.
If you have ever put a returns business case in front of a CFO and watched it not land, the problem was probably not your conclusion. It was your first number.
Why? Because the cost per return most teams use is return freight plus the refund, sometimes with a flat handling fee that someone estimated years ago and nobody has revisited since. It is a defensible number. It is also wrong in a predictable direction, and the people in the room can usually feel that it is wrong even when they cannot say why.
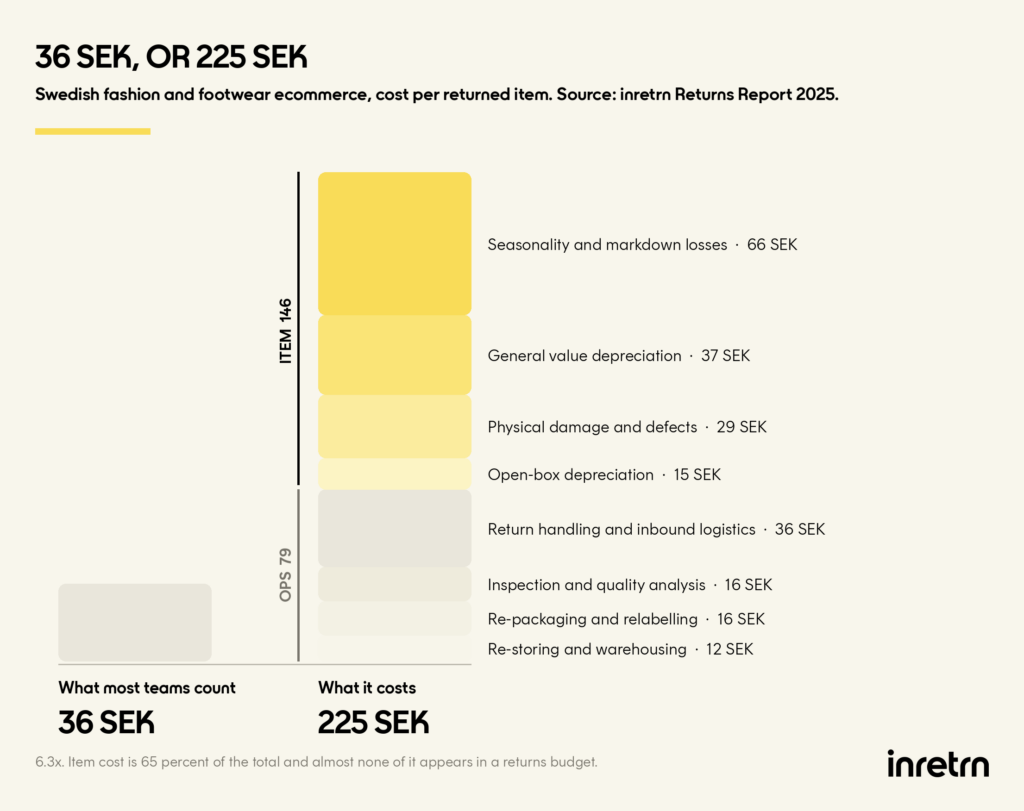
How wrong: in Swedish fashion and footwear the freight line is around 36 SEK per returned item, and the full cost is 225. Two thirds of that is not operational at all. It is value that does not come back with the item.
That gap is expensive in a specific way. It is not that you lose the argument. It is that you lose it quietly: the case gets a polite hearing, goes on a list, and reappears next year with the same number on it.
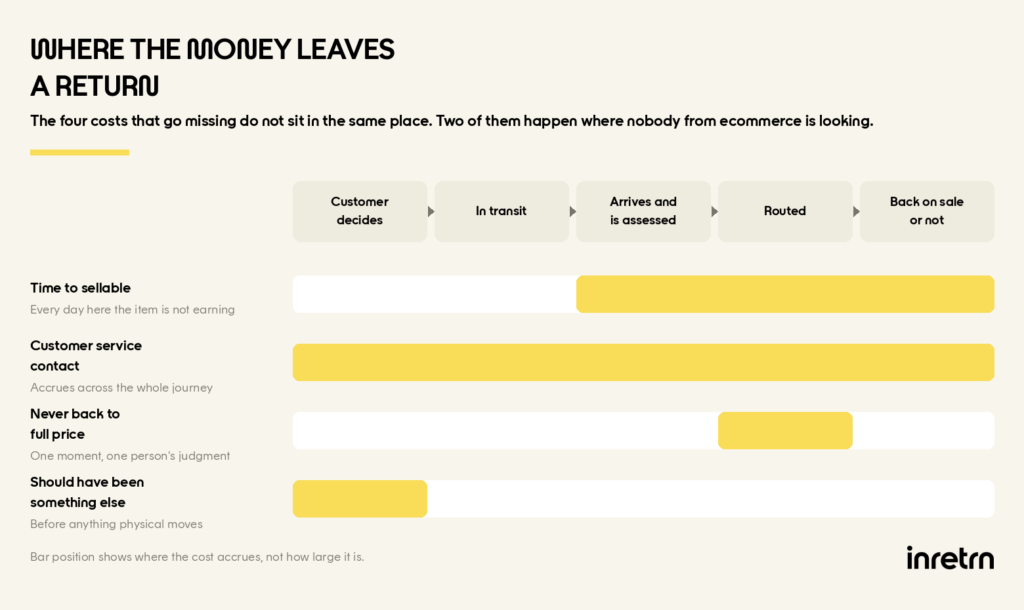
This is not an argument that returns cost more than you think. You already suspect that. It is a breakdown of the four cost lines that go missing, where each one actually sits in your systems, and how to get a number you can defend.
If you already separate return handling from return freight in your P&L, skip to cost 3. That is where most people who have done this work still have a gap.
Two accounting habits do most of the damage, and neither of them is anyone’s mistake.
The first is that returns are split across budgets that never meet. Freight sits with logistics. Refunds sit with finance. Customer service time sits with support. Warehouse labour sits with operations. Every one of those teams can tell you their own number, and not one of them owns the total. When somebody finally builds a case, they use the number that is easiest to retrieve, which is freight.
The second is that return cost is measured as an average, and returns are not an average process. A pair of socks and a technical jacket cost the same to ship back and nothing like the same to process. Averaging them produces a number that is wrong for both, and it hides the fact that a small share of returns consumes most of the cost.
The result is a number that is easy to produce, easy to agree on, and too low to justify changing anything.
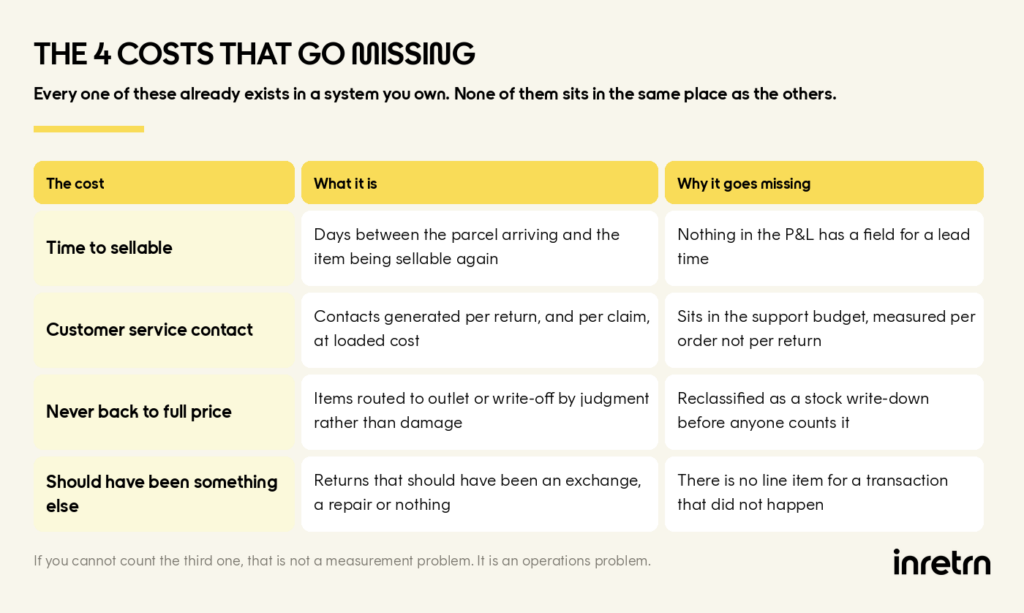
What it is: the elapsed time between a returned parcel arriving at your warehouse and the item being available to sell again at full price.
Why it goes missing: it is a lead time, not a line item. Nothing in your P&L has a field for it, so it never enters the calculation even though it directly determines revenue.
Where the data sits: the timestamp when the return is received in your WMS, and the timestamp when stock is made available again in your ERP or ecommerce platform. Both exist. They are rarely compared.
How to count it: take the median days between those two timestamps, then apply your own markdown curve. In fashion and seasonal categories, a week is often the difference between full price and outlet. Multiply by the share of returns that arrive in the last four weeks of a season, which is where the damage concentrates.
The thing that surprises people: the median is usually fine. It is the tail that costs money, and the tail is worst exactly when volume is highest.
What it is: not a cost line. A loop.
Why it goes missing: because it never shows up as a return cost anywhere. In our analysis of Swedish fashion, customer service and administration is booked at zero SEK per returned item. Not because it is free, but because it sits in the support budget, measured per order rather than per return.
What actually happens: manual handling means every item waits for a person. The queue grows. While an item sits in the queue the customer has no status, no refund and no date, so the customer gets in touch. That contact lands on the same team trying to clear the queue, so the queue grows further. And the item that is now three weeks deep in that queue is the item that misses the season.
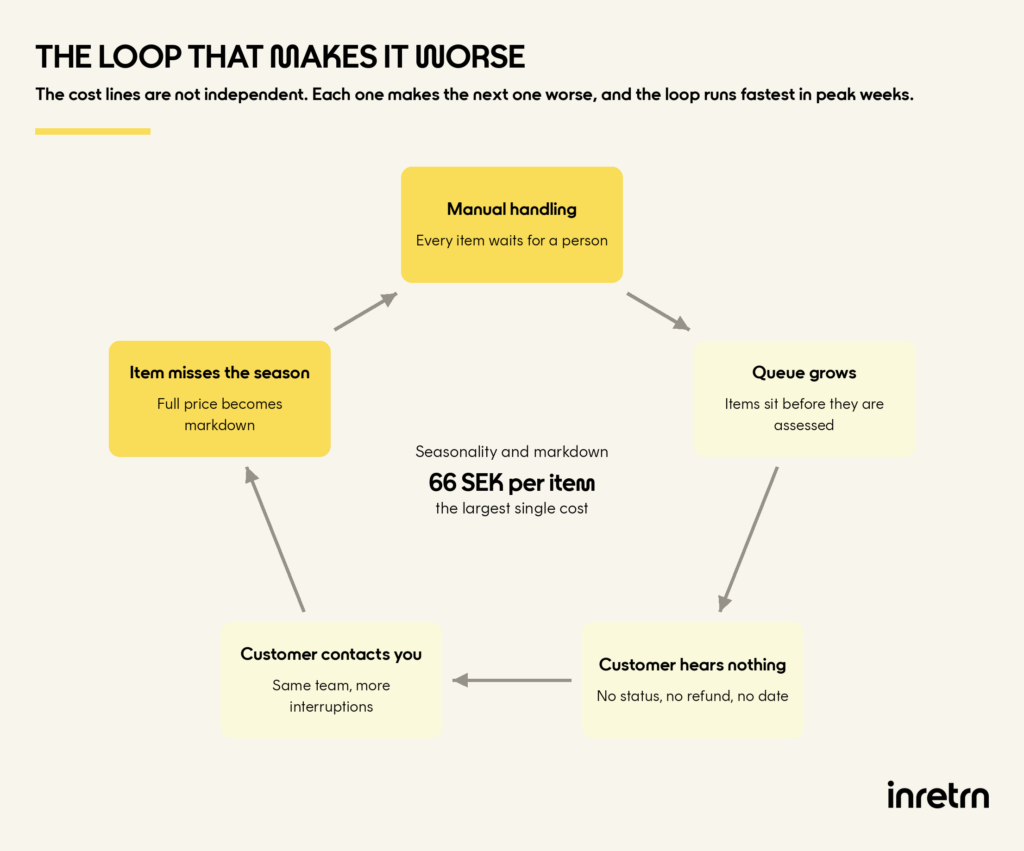
How to count it: you cannot, cleanly, and that is the point. What you can do is measure the inputs. Tickets tagged to returns with no status update. Median queue length in week 47 against week 20. If those two numbers move together, you have found the loop.
The thing that surprises people: costs that feed each other do not add, they compound. And they compound hardest exactly when volume is highest, which is also when you are least staffed to absorb it. An average cost per return hides all of it
What it is: the share of returned items that could have been resold at full price and were not, because of how the condition decision was made.
Why it goes missing: it looks like a stock write-down, not a return cost. By the time it shows up in the numbers, it has been reclassified as something else.
Where the data sits: condition codes entered at goods receipt, joined to what eventually happened to the item. If condition codes are not consistently entered, this is the cost you cannot see at all.
How to count it: take returned items routed to outlet, charity or write-off, and estimate what share of those were routed there because of a judgment call rather than actual damage. Multiply by the margin difference.
The thing that surprises people: the assessment itself is not the problem. A person unpacking a parcel can tell that a jacket smells of smoke, and no software can. The problem is what happens after the assessment. The routing decision, which is rules-driven and knowable, is usually made by whoever knows how you normally do it. That works until that person is off sick, or it is week 47 and the returns room is staffed by temps who have never seen your outlet rules.
What it is: returns that should have been an exchange, a repair, a partial refund, or nothing at all, and became a full return because that was the only path your setup offered.
Why it goes missing: there is no line item for a transaction that did not happen. This is opportunity cost, and it is invisible by construction.
Where the data sits: return reasons. Specifically the share coded as wrong size, which in most apparel operations is the largest single reason and is the one that should have been an exchange.
How to count it: wrong-size returns times your average order value times the share you would realistically convert. Then add the returns processed at full cost where the item was worth less than the handling: the ones where taking it back was the wrong commercial decision and nobody had the authority or the data to decide otherwise in the moment.
The thing that surprises people: this is frequently the largest of the four, and it is the one nobody has on a slide. It is also the one that most directly answers a CFO asking what the upside is rather than what the saving is.
One Nordic sports retailer counted handling cost per return at 50 SEK. After the routing decisions were automated, it was 8.50.
The 8.50 is not the point. The point is what the 50 unlocked: with the real number in front of them, the case built itself, and the same work also cut lead time by more than half and lifted full-price sales by around 10 percent.
And the shape holds at market level. Across Swedish fashion ecommerce, the single largest cost line is not freight and not damage. It is seasonality and markdown, at 66 SEK per returned item, nearly twice the freight. A timing cost, in other words, which is exactly the cost the loop above produces.
Zooming out, two things are worth taking from this.
The number you can defend beats the number that is convenient. A cost per return you have built from four separate sources is harder work and much harder to argue with. It also survives the meeting you are not in, which is usually the meeting that decides.
The four costs are not equally hard to get at. Cost 1 is two timestamps and you can have it this week. Cost 2 cannot be counted directly at all, only inferred from its inputs. Costs 3 and 4 require condition codes and return reasons to be captured consistently, which for many operations is the actual finding. If you cannot count cost 3, that is not a measurement problem. It is an operations problem wearing a measurement problem’s clothes.
Four questions to put on the agenda of your next planning meeting. They are deliberately answerable without a project.
You do not need a vendor to answer any of these. You need them answered before a vendor conversation is worth having, including one with us.
Next in this series: why “it works fine” is the most expensive sentence in a returns business case, and how to build a case against a setup that is not broken.
Jennie Gerum CMO, inretrn
Two very different things hide behind the word "exchange" A customer wants a medium instead of a large. Simple enough. Here is what makes it hard. To say yes, you have to promise them th...
The best returns experience generates no tickets at all Every team we speak to says the saving is customer service time. Almost nobody has counted it, and almost everybody is measuring the ...
You asked. We answered. Everything from the Withdrawal Webinar Q&A - in one place. Book a walkthrough ...